Sakshi Education
Definition of Genome
Genome is originally defined as a basic (monoploid) chromosome set (x). Genome size refers to the complete set of DNA sequences, in a single haploid nucleus, such as in a sperm or egg or a single set of chromosomes. To avoid confusion with chromosome number, Swift introduced the term “C-value” (“C” standing for “Constant”) in 1951. The DNA amount in the unreplicated gametic nucleus is referred to as its C-value. 1C refers to the DNA amount in an unreplicated gametic chromosome set (n) of an organism. This usage applies irrespective of ploidy level, so it is important to understand that whereas genome size equals the 1C DNA amount in a diploid species; genome size is always less than the 1C DNA amount in polyploid species. DNA amounts are usually expressed in picograms (pg) or in megabase pairs of nucleotides (Mb) (NB 1 pg =10-12 g; 1 Mb =10-6 nucleotide base pairs; 1 pg = 980 Mb).
One pg is equivalent to approximately 1 billion base pairs. Human genome is approximately 3 billion base pairs (bp).
C- value Paradox
The existence of major differences in C-value raises questions concerning its origin and significance. Huge variation in genome size unrelated to organismal complexity was epitomised as “the C-value paradox” by Thomas in 1971. Such differences are now largely attributed to changes in the proportion of noncoding, repetitive DNA sequences (e.g., transposable elements) and the extent of genome duplication. The puzzle now is to understand the molecular mechanisms and evolutionary pressures that determine the amounts of repetitive DNA in species genomes and thus their genome sizes.
Genome Complexity in Eukaryotes
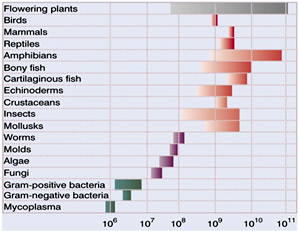
Eukaryotic genomes differ considerably in terms of their genome size and number of genes. "There is a remarkable lack of correspondence between genome size and organism complexity, especially among eukaryotes. For example, the marbled lungfish, Protopterus aethiopicus, (largest recorded Eukaryotic Genome) of any has more than 40 times the amount of DNA per cell than humans!"
Complexity of an organism can neither be inferred from the number of protein-coding genes. Estimated number of protein-coding genes in Human genome are about 20,000 to 25,000. Whereas in Trichomonas vaginalis protozoan, the number hovers around 60,000. The fruit fly Drosophila melanogaster has 13,000, the mustard plant Arabidopsis thaliana has about 25,500 protein-coding genes.
These observations suggest that there is more to the genome than protein-coding genes alone. It has been observed that mouse genome 60% of this 2.5 billion bp genome is transcribed, but less than 2% is actually translated into functional protein products. Majority of the transcripts are utilized as tRNA, rRNA, and many RNAs involved in splicing and gene regulation.
Mechanisms like Alternative splicing produce multiple proteins from a single gene, or transcription unit. Phenotypic complexity of organisms can also be generated by other mechanisms like RNA editing, trans-splicing, and tandem chimerism.
RNA editing is the only known mechanism where nucleotide changes are made at the RNA after transcription—for example, the modification of a cytosine to a uracil before an mRNA molecule is translated into a protein.
Trans-splicing is the splicing together of separate transcripts to form an mRNA molecule, as opposed to alternative splicing, which is the splicing together of exons from the same transcript. Tandem chimerism occurs when adjacent transcription units are transcribed together to form a single "chimeric" mRNA molecule.
Therefore in a given organism although the number of genes are more they do not operate at that same level of complexity. In addition many of the genes are simply copies of each other and about half are believed to be "pseudogenes," or DNA sequences that are similar to functional protein-coding genes but have lost their protein-encoding capacities.
Organismal complexity is thus the result of much more than the sheer number of nucleotides that compose a genome and the number of coding sequences in that genome. Evidently from the above observations it becomes quite clear that while size is one component of organismal complexity, its contribution to that complexity is small.
Applications of C-values or Genome Size
DNA C-values have many uses. C-value reference lists provided data for comparative studies at levels ranging from the biosphere to genome organization, and in diverse disciplines including phylogeny, ecology, genomics, cell biology, conservation, physiology, and development.
Nucleotypic Effects
DNA affects the phenotype in two ways: first by its genic content, and second by the physical consequences of its mass and volume, independently of its encoded information (i.e. nucleotypic effects).
Nuclear DNA amount shows strikingly close nucleotypic correlations with many widely different phenotypic and phenological characters at cell, tissue, and organismic levels, e.g., chromosome size, chloroplast number, pollen volume, duration of meiosis, seed weight and minimum generation time. Thus, C-value is a key factor in scaling the size and rate of development of living systems.
Kinetics of DNA recombination
As we all know DNA is double stranded and two strands of DNA bear complimentary sequences. When DNA is denatured by heat the two strands can still continue with each other by complementary base pairing at lower temperatures. The principle holds too even when the DNA is fragmented followed by denaturation and renaturation. The process of renaturation is essentially nothing but formation of bonds between the two participating DNA molecules. The initial step is based on random collision of molecules.
If the colliding DNA sequences are complimentary, bond formation occurs which gradually extends in both directions very quickly and if they are not complimentary then they detach. Therefore the rate limiting factor in renaturation is collision of molecules. As per molecular collision theory, number of collisions increases with increase in concentration of molecules. Therefore rate of DNA reassociation increases with increase in concentration of DNA molecules. Not only the DNA concentration, the complexity of the DNA sequences also matters. Complexity here refers to the presence of number of possible pairing partners (complimentary sequences) for any given DNA sequences (strands) present in the renaturing solution.
For example, if two DNA strands of 10kb length, one consisting of polydA:dU sequences and another DNA molecule of random sequences are denatured and renatured, then it is obvious that the DNA molecule with polydA:dU sequences will pair first as dA nucleotides will be complimentary to dU nucleotide in opposite strand and similarly the neighbouring nucleotides will also be complimentary. This is not the sceniaro with the random sequences because the colloiding nucleotides may or may not be complimentary. Therefore due to hit and trail process, more collisions are required to find the complementary sequences and hence it takes more time. Thus from the above experiment it is easy to conclude that poly dA: dU DNA molecules renature first and is less complex and DNA molecule with random sequences takes more time and is more complex i.e., contains different types of nucleotides sequenced or is more varied than the other. In other words, “Fragments containing more numerous repeated sequences will renature more rapidly than the fragments containing portions of unique sequence.
Let us consider another example where a DNA molecule of 10,000bp contains 100 tandem repeats of a repeated sequence of 100bp in length. If the DNA molecule is fragmented into 100 fragments roughly of equal size, then each fragment will contain 100bp roughly. When such a DNA molecule is renatured, the renaturation curve will have simple single step but the rate of renaturation will be characteristic of the length in 100bp fragment. Thus if a genome contains multiple families of repeated sequences whose abundance differ, renaturation curve will have steps, one step for each repeating sequence. This principle is the basis for analyzing complexity of genomics based on renaturation kinetics. This is usually done by cot curve analysis.
Cot Curve analysis
Mathematically DNA renaturation kinetics is described as
C/Co = 1/(1+k Cot)
where C represents concentration of single strand DNA at a given time t.
Co represents initial concentration (moles of nucleotides per litre)
k represents constant whose value depends on type of solvent used for renaturation.
Co t representation (moles -1. Sec -1)
A Cot curve is a plot of C/ Co Vs Cot.
 When renaturation is half complete i.e. at t1/2 C/CO =1/2, then Cot1/2 = 1/k Fraction of DNA renatured at time t can be estimated by separating dsDNA from rest of the unrenatured DNA using Hydroxyapatite chromatography. It is a form of calcium phosphate that specifically binds to dsDNA
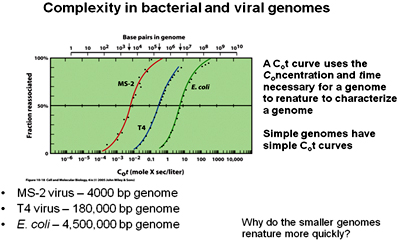
 The above Cot curve representing the renatuation kinetics of typical bacterial and viral genomes, which has a simple (sigmoidal) curve indicating the presence of a simple genome. All the three genomes represent similar curves but it can be observed that the curve of T4 phage is towards the right of MS2 and the curve of E.coli is towards the right of T4 phage. This determines that although the three genomes are simple and show similar curves they vary in their Genome sizes. MS2 being smaller in size renatures first followed by T4 phage and then by E.coli.
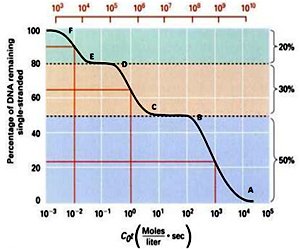
The above Cot curve represents analysis of renaturation kinetics of a typical eukaryotic genome. It clears represents a step wise curve with three phases of renaturation revealing the presence of three major types of sequences in the genome. The phase from point A-B, in the above Cot curve, represents fraction of DNA that undergoes renaturation first and is termed as Highly repetitive DNA, followed by the phase (C-D) showing fraction of DNA undergoing renaturation second, is termed as Moderately repetitive DNA and the phase (E-F) represents fraction of DNA renaturing last and is termed as Unique DNA.
Highly Repetitive DNA
 Represents 50% of the genome. The Cot value ranges from 104-102. The Cot1/2 value equals 103. It mainly includes satellite DNA sequences, minisatelites and microsatelites. This class includes sequences of length 5-300 nucleotide base pairs per repeat and present in as many as 105 copies in the genome.
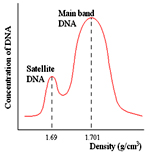
Satellite DNA sequences are identical or nearly identical, tandemly arrayed sequences accounting to approximately 1-10% of eukaryotic genomes. Satellite DNA is repetitive DNA that could be separated by buoyant density
Minisatellites are tandem repeats of 10 – 100 bp repeats for example-
5’-ATCAAATCTGGATCAAATCTGGATCAAATCTGG-3’.
DNA fingerprinting utilizes polymorphic minisatellite DNA – CODIS loci
Microsatellites are tandem repeats of 1 – 10 bp repeats, for eg.
5’-ATCATCATCATCATCATCATC-3’
Microsatellites are used as DNA markers.
Moderately Repetitive DNA
This fraction constitutes approximately 30% of the genome. The Cot value ranges from 101-10-1 It includes sequences that are present as 10-1000 copies in the genome. These sequences mainly include tandemly repeated rRNA, tRNA and histone genes (gene products needed in high amounts), large duplicated gene families and mobile DNA (transposons) Transposons is discussed separately in the next article.
Unique DNA
This fraction constitutes approximately 20% of the genome. The Cot value ranges from 10-1 to 10-3. It includes sequences that are present as 10-1000 copies in the genome. These sequences mainly include protein coding genes, RNA coding genes and pseudogenes.
Pseudogenes are non functional copies of genes that form a part of the unique dna and are inherited stably from one generation to another.
What is a gene?
A Gene is a functional segment of DNA which in conjunction with other regulatory elements may code for a RNA or/and polypeptide/ protein. According to the modern definition of gene three regions namely, Promoter, Coding sequence and a terminator constitute a gene. As mentioned, genes are the functional segments of the genome. Their function is to code for RNA or proteins. The genetic information contained in the genes is used for synthesizing the products.
How genes function?
The process of synthesizing these products like RNA and/or proteins is called Gene Expression. Gene Expression consists of two stages – Transcription and Translation. Transcription is the process of synthesizing RNA from DNA. The products of transcription are mainly of four types-mRNA, rRNA, tRNA and ncRNA. Translation is the process of synthesizing proteins using mRNA as template. During translation three consecutive nucleotides in the mRNA are read as one codon, which represents an amino acid.
Transcription is mediated by an enzyme called RNA polymerase in association with other proteins. RNA polymerase identifies the genes based on the promoter sequence. A promoter is region of the gene where RNA polymerase binds and accomplishes transcription. Promoters are usually present upstream which (of the gene, towards the 5’ end) not only help the RNA pol to identify the gene but also directs the transcription process. Promoters also control the transcription efficiency. After recognizing the promoter of a gene, RNA pol moves ahead in 5’--->3’ direction across the coding sequence, synthesizing RNA.
A coding sequence (CDS, cds) is a subsequence of a DNA sequence that is surmised to encode a gene. A CDS begins with an initiation codon (ATG) and ends with a stop codon. RNA is synthesized by complementary base pairing with the template strand of DNA, template strand is one of the two DNA strands appearing after separating the double stranded DNA. RNA pol continues synthesizing the DNA till it reaches the terminator region in the gene. A terminator is the region of the gene where RNA looses grip and detaches from the DNA to release the daughter RNA so formed. In this manner transcription is accomplished. Therefore, promoters and terminators are considered as an integral part of the gene but are not a part of the RNA produced and remain as non coding regions.
Noncoding regions can be parts of genes, either as regulatory elements like promoters and terminators or as intervening sequences like introns. Untranslated regions (UTRs) occur in both DNA and RNA. They are portions of the sequence flanking the final coding sequence. The 5' UTR at the 5' end contains promoter site, and the 3' UTR at the 3' end is highly specific both to the gene and to the species from which the sequence is derived.
It is possible to translate a piece of DNA sequence into protein by reading successive codons with reference to a genetic code table. This is termed the conceptual translation, which has no biological validation or significance. Because it is not known whether the first base marks the start of the CDS, it is always essential to perform a six-frame translation. This includes three forward frames that are accomplished by beginning to translate at the first, second, and third bases, respectively, and three reverse frames that are achieved by reversing DNA sequence (the complementary strand) and again beginning on the first, second, and third bases.
Thus for any DNA genome, the result of a six-frame translation is six potential protein sequences of which only one is biologically functional. The correct reading frame is normally taken to be the longest frame uninterrupted by a stop codon (TGA, TAA, or TAG). Such a frame is known as an open reading frame (ORF). An ORF corresponds to a stretch of DNA that could potentially be translated into a polypeptide. For an ORF to be considered as a good candidate for coding a cellular protein, a minimum size requirement is often set — for example, a stretch of DNA that would code for a protein of at least 100 amino acids. An ORF is not usually considered equivalent to a gene until there has been shown to be a phenotype associated with a mutation in the ORF, and/or an mRNA transcript or a gene product generated from the DNA molecule of ORF has been detected.
Gene structure
Apart from ATG as start codon, several features may be used as indicators of potential protein coding regions in DNA such as sufficient ORF length, flanking Kozak sequence (CCGCCATGG), species-specific codon usage bias, and detection of ribosome binding sites upstream of the start codon of prokaryotic genes. Ultimately, the surest way of predicting a gene is by alignment with a homologous protein sequence.
The eukaryotic genes are characterized by (a) regions that contribute to the CDS, known as exons, and (b) those that do not contribute, known as introns. The presence of exons and introns in eukaryotic genes results in potential gene products with different lengths because not all exons are jointed in the final transcribed mRNA. The proteins resulting from the mRNA editing process with different translated polypeptide chains are known as splice variants or alternatively spliced forms.
It is known that during the process of evolution genomes have undergone changes both in terms of quality and quantity. However, depending on the divergence in terms of time of evolution, the gene sequences are conserved across genera and families. Comparative genomics has indicated that the arrangements of segments of chromosomes are conserved across genera and groups of genes are moved as syntenic segments. This information about the genomes and their evolution has greatly facilitated isolation of genes from one species when the information on the orthologous or paralogous forms of the genes is available.
References
The existence of major differences in C-value raises questions concerning its origin and significance. Huge variation in genome size unrelated to organismal complexity was epitomised as “the C-value paradox” by Thomas in 1971. Such differences are now largely attributed to changes in the proportion of noncoding, repetitive DNA sequences (e.g., transposable elements) and the extent of genome duplication. The puzzle now is to understand the molecular mechanisms and evolutionary pressures that determine the amounts of repetitive DNA in species genomes and thus their genome sizes.
Genome Complexity in Eukaryotes
Eukaryotic genomes differ considerably in terms of their genome size and number of genes. "There is a remarkable lack of correspondence between genome size and organism complexity, especially among eukaryotes. For example, the marbled lungfish, Protopterus aethiopicus, (largest recorded Eukaryotic Genome) of any has more than 40 times the amount of DNA per cell than humans!"
Complexity of an organism can neither be inferred from the number of protein-coding genes. Estimated number of protein-coding genes in Human genome are about 20,000 to 25,000. Whereas in Trichomonas vaginalis protozoan, the number hovers around 60,000. The fruit fly Drosophila melanogaster has 13,000, the mustard plant Arabidopsis thaliana has about 25,500 protein-coding genes.
These observations suggest that there is more to the genome than protein-coding genes alone. It has been observed that mouse genome 60% of this 2.5 billion bp genome is transcribed, but less than 2% is actually translated into functional protein products. Majority of the transcripts are utilized as tRNA, rRNA, and many RNAs involved in splicing and gene regulation.
Mechanisms like Alternative splicing produce multiple proteins from a single gene, or transcription unit. Phenotypic complexity of organisms can also be generated by other mechanisms like RNA editing, trans-splicing, and tandem chimerism.
RNA editing is the only known mechanism where nucleotide changes are made at the RNA after transcription—for example, the modification of a cytosine to a uracil before an mRNA molecule is translated into a protein.
Trans-splicing is the splicing together of separate transcripts to form an mRNA molecule, as opposed to alternative splicing, which is the splicing together of exons from the same transcript. Tandem chimerism occurs when adjacent transcription units are transcribed together to form a single "chimeric" mRNA molecule.
Therefore in a given organism although the number of genes are more they do not operate at that same level of complexity. In addition many of the genes are simply copies of each other and about half are believed to be "pseudogenes," or DNA sequences that are similar to functional protein-coding genes but have lost their protein-encoding capacities.
Organismal complexity is thus the result of much more than the sheer number of nucleotides that compose a genome and the number of coding sequences in that genome. Evidently from the above observations it becomes quite clear that while size is one component of organismal complexity, its contribution to that complexity is small.
Applications of C-values or Genome Size
DNA C-values have many uses. C-value reference lists provided data for comparative studies at levels ranging from the biosphere to genome organization, and in diverse disciplines including phylogeny, ecology, genomics, cell biology, conservation, physiology, and development.
Nucleotypic Effects
DNA affects the phenotype in two ways: first by its genic content, and second by the physical consequences of its mass and volume, independently of its encoded information (i.e. nucleotypic effects).
Nuclear DNA amount shows strikingly close nucleotypic correlations with many widely different phenotypic and phenological characters at cell, tissue, and organismic levels, e.g., chromosome size, chloroplast number, pollen volume, duration of meiosis, seed weight and minimum generation time. Thus, C-value is a key factor in scaling the size and rate of development of living systems.
Kinetics of DNA recombination
As we all know DNA is double stranded and two strands of DNA bear complimentary sequences. When DNA is denatured by heat the two strands can still continue with each other by complementary base pairing at lower temperatures. The principle holds too even when the DNA is fragmented followed by denaturation and renaturation. The process of renaturation is essentially nothing but formation of bonds between the two participating DNA molecules. The initial step is based on random collision of molecules.
If the colliding DNA sequences are complimentary, bond formation occurs which gradually extends in both directions very quickly and if they are not complimentary then they detach. Therefore the rate limiting factor in renaturation is collision of molecules. As per molecular collision theory, number of collisions increases with increase in concentration of molecules. Therefore rate of DNA reassociation increases with increase in concentration of DNA molecules. Not only the DNA concentration, the complexity of the DNA sequences also matters. Complexity here refers to the presence of number of possible pairing partners (complimentary sequences) for any given DNA sequences (strands) present in the renaturing solution.
For example, if two DNA strands of 10kb length, one consisting of polydA:dU sequences and another DNA molecule of random sequences are denatured and renatured, then it is obvious that the DNA molecule with polydA:dU sequences will pair first as dA nucleotides will be complimentary to dU nucleotide in opposite strand and similarly the neighbouring nucleotides will also be complimentary. This is not the sceniaro with the random sequences because the colloiding nucleotides may or may not be complimentary. Therefore due to hit and trail process, more collisions are required to find the complementary sequences and hence it takes more time. Thus from the above experiment it is easy to conclude that poly dA: dU DNA molecules renature first and is less complex and DNA molecule with random sequences takes more time and is more complex i.e., contains different types of nucleotides sequenced or is more varied than the other. In other words, “Fragments containing more numerous repeated sequences will renature more rapidly than the fragments containing portions of unique sequence.
Let us consider another example where a DNA molecule of 10,000bp contains 100 tandem repeats of a repeated sequence of 100bp in length. If the DNA molecule is fragmented into 100 fragments roughly of equal size, then each fragment will contain 100bp roughly. When such a DNA molecule is renatured, the renaturation curve will have simple single step but the rate of renaturation will be characteristic of the length in 100bp fragment. Thus if a genome contains multiple families of repeated sequences whose abundance differ, renaturation curve will have steps, one step for each repeating sequence. This principle is the basis for analyzing complexity of genomics based on renaturation kinetics. This is usually done by cot curve analysis.
Cot Curve analysis
Mathematically DNA renaturation kinetics is described as
C/Co = 1/(1+k Cot)
where C represents concentration of single strand DNA at a given time t.
Co represents initial concentration (moles of nucleotides per litre)
k represents constant whose value depends on type of solvent used for renaturation.
Co t representation (moles -1. Sec -1)
A Cot curve is a plot of C/ Co Vs Cot.
When renaturation is half complete i.e. at t1/2 C/CO =1/2, then Cot1/2 = 1/k Fraction of DNA renatured at time t can be estimated by separating dsDNA from rest of the unrenatured DNA using Hydroxyapatite chromatography. It is a form of calcium phosphate that specifically binds to dsDNA The above Cot curve representing the renatuation kinetics of typical bacterial and viral genomes, which has a simple (sigmoidal) curve indicating the presence of a simple genome. All the three genomes represent similar curves but it can be observed that the curve of T4 phage is towards the right of MS2 and the curve of E.coli is towards the right of T4 phage. This determines that although the three genomes are simple and show similar curves they vary in their Genome sizes. MS2 being smaller in size renatures first followed by T4 phage and then by E.coli. The above Cot curve represents analysis of renaturation kinetics of a typical eukaryotic genome. It clears represents a step wise curve with three phases of renaturation revealing the presence of three major types of sequences in the genome. The phase from point A-B, in the above Cot curve, represents fraction of DNA that undergoes renaturation first and is termed as Highly repetitive DNA, followed by the phase (C-D) showing fraction of DNA undergoing renaturation second, is termed as Moderately repetitive DNA and the phase (E-F) represents fraction of DNA renaturing last and is termed as Unique DNA.
Highly Repetitive DNA
Represents 50% of the genome. The Cot value ranges from 104-102. The Cot1/2 value equals 103. It mainly includes satellite DNA sequences, minisatelites and microsatelites. This class includes sequences of length 5-300 nucleotide base pairs per repeat and present in as many as 105 copies in the genome.Satellite DNA sequences are identical or nearly identical, tandemly arrayed sequences accounting to approximately 1-10% of eukaryotic genomes. Satellite DNA is repetitive DNA that could be separated by buoyant density
Minisatellites are tandem repeats of 10 – 100 bp repeats for example-
5’-ATCAAATCTGGATCAAATCTGGATCAAATCTGG-3’.
DNA fingerprinting utilizes polymorphic minisatellite DNA – CODIS loci
Microsatellites are tandem repeats of 1 – 10 bp repeats, for eg.
5’-ATCATCATCATCATCATCATC-3’
Microsatellites are used as DNA markers.
Moderately Repetitive DNA
This fraction constitutes approximately 30% of the genome. The Cot value ranges from 101-10-1 It includes sequences that are present as 10-1000 copies in the genome. These sequences mainly include tandemly repeated rRNA, tRNA and histone genes (gene products needed in high amounts), large duplicated gene families and mobile DNA (transposons) Transposons is discussed separately in the next article.
Unique DNA
This fraction constitutes approximately 20% of the genome. The Cot value ranges from 10-1 to 10-3. It includes sequences that are present as 10-1000 copies in the genome. These sequences mainly include protein coding genes, RNA coding genes and pseudogenes.
Pseudogenes are non functional copies of genes that form a part of the unique dna and are inherited stably from one generation to another.
What is a gene?
A Gene is a functional segment of DNA which in conjunction with other regulatory elements may code for a RNA or/and polypeptide/ protein. According to the modern definition of gene three regions namely, Promoter, Coding sequence and a terminator constitute a gene. As mentioned, genes are the functional segments of the genome. Their function is to code for RNA or proteins. The genetic information contained in the genes is used for synthesizing the products.
How genes function?
The process of synthesizing these products like RNA and/or proteins is called Gene Expression. Gene Expression consists of two stages – Transcription and Translation. Transcription is the process of synthesizing RNA from DNA. The products of transcription are mainly of four types-mRNA, rRNA, tRNA and ncRNA. Translation is the process of synthesizing proteins using mRNA as template. During translation three consecutive nucleotides in the mRNA are read as one codon, which represents an amino acid.
Transcription is mediated by an enzyme called RNA polymerase in association with other proteins. RNA polymerase identifies the genes based on the promoter sequence. A promoter is region of the gene where RNA polymerase binds and accomplishes transcription. Promoters are usually present upstream which (of the gene, towards the 5’ end) not only help the RNA pol to identify the gene but also directs the transcription process. Promoters also control the transcription efficiency. After recognizing the promoter of a gene, RNA pol moves ahead in 5’--->3’ direction across the coding sequence, synthesizing RNA.
A coding sequence (CDS, cds) is a subsequence of a DNA sequence that is surmised to encode a gene. A CDS begins with an initiation codon (ATG) and ends with a stop codon. RNA is synthesized by complementary base pairing with the template strand of DNA, template strand is one of the two DNA strands appearing after separating the double stranded DNA. RNA pol continues synthesizing the DNA till it reaches the terminator region in the gene. A terminator is the region of the gene where RNA looses grip and detaches from the DNA to release the daughter RNA so formed. In this manner transcription is accomplished. Therefore, promoters and terminators are considered as an integral part of the gene but are not a part of the RNA produced and remain as non coding regions.
Noncoding regions can be parts of genes, either as regulatory elements like promoters and terminators or as intervening sequences like introns. Untranslated regions (UTRs) occur in both DNA and RNA. They are portions of the sequence flanking the final coding sequence. The 5' UTR at the 5' end contains promoter site, and the 3' UTR at the 3' end is highly specific both to the gene and to the species from which the sequence is derived.
It is possible to translate a piece of DNA sequence into protein by reading successive codons with reference to a genetic code table. This is termed the conceptual translation, which has no biological validation or significance. Because it is not known whether the first base marks the start of the CDS, it is always essential to perform a six-frame translation. This includes three forward frames that are accomplished by beginning to translate at the first, second, and third bases, respectively, and three reverse frames that are achieved by reversing DNA sequence (the complementary strand) and again beginning on the first, second, and third bases.
Thus for any DNA genome, the result of a six-frame translation is six potential protein sequences of which only one is biologically functional. The correct reading frame is normally taken to be the longest frame uninterrupted by a stop codon (TGA, TAA, or TAG). Such a frame is known as an open reading frame (ORF). An ORF corresponds to a stretch of DNA that could potentially be translated into a polypeptide. For an ORF to be considered as a good candidate for coding a cellular protein, a minimum size requirement is often set — for example, a stretch of DNA that would code for a protein of at least 100 amino acids. An ORF is not usually considered equivalent to a gene until there has been shown to be a phenotype associated with a mutation in the ORF, and/or an mRNA transcript or a gene product generated from the DNA molecule of ORF has been detected.
Gene structure
Apart from ATG as start codon, several features may be used as indicators of potential protein coding regions in DNA such as sufficient ORF length, flanking Kozak sequence (CCGCCATGG), species-specific codon usage bias, and detection of ribosome binding sites upstream of the start codon of prokaryotic genes. Ultimately, the surest way of predicting a gene is by alignment with a homologous protein sequence.
The eukaryotic genes are characterized by (a) regions that contribute to the CDS, known as exons, and (b) those that do not contribute, known as introns. The presence of exons and introns in eukaryotic genes results in potential gene products with different lengths because not all exons are jointed in the final transcribed mRNA. The proteins resulting from the mRNA editing process with different translated polypeptide chains are known as splice variants or alternatively spliced forms.
It is known that during the process of evolution genomes have undergone changes both in terms of quality and quantity. However, depending on the divergence in terms of time of evolution, the gene sequences are conserved across genera and families. Comparative genomics has indicated that the arrangements of segments of chromosomes are conserved across genera and groups of genes are moved as syntenic segments. This information about the genomes and their evolution has greatly facilitated isolation of genes from one species when the information on the orthologous or paralogous forms of the genes is available.
References
- Pray, L. (2008) What is a Gene? Colinearity and Transcription Units. Nature Education 1(1):97.
- Pray, L. (2008) Eukaryotic Genome Complexity. Nature Education 1(1):96.
- Parra, G., et al. (2006) Tandem Chimerism as a Means to Increase Protein Complexity in the Human Genome. Genome Research 16, 37–44.
- Gregory, T. R. (2005) Synergy between Sequence and Size in Large-scale Genomics. Nature Reviews Genetics 6, 699–708.
- Ryan Gregory, T (2002) Genome Size and Developmental Complexity. Genetica 115: 131–146.
Published date : 14 May 2014 06:10PM


More Articles