

Sakshi Education

Concept of Steady State
Study of Enzyme Kinetics in vitro usually makes use of enzymes in low concentrations in the range of 10-8 and 10-10 molL-1, whereas substrate concentrations are usually m molL-1 or µmolL-1. Initially when enzyme and substrates are mixed, some enzyme is rapidly transformed to enzyme–substrate complexes. Subsequently during the initial transient period and the rate of change of the concentration of any enzyme form is very small compared with the rate of change of the substrate concentrations. That is, the rate of change of an enzyme forms with a concentration of 10-8 molL-1is always much less than the rate of change of a substrate with a concentration of 10-5 molL-1. Since the change in the levels of the various enzyme forms occurs very slowly with time, a ‘steady state’ exists. The concept of steady state always holds good whenever the concentrations of substrate are exceeding an order of magnitude higher than the enzyme level, which is usually the case for enzyme assays. Therefore the initial rate depends on initial concentration of substrate. At low substrate concentration the initial rate is proportional to initial substrate concentration. At high substrate concentration, the initial rate approaches an upper limit called the maximum rate (Vmax). In cells, under most situations; there exists a dynamic steady state, where the rate of generation of substrates is similar to the rate of removal of products. Thus the equations that describe steady state kinetics will apply to enzymes in cells as long as free, rather than total, concentrations of substrates are used in the equations
Michaelis- Menten Equation:
This equation is possible by considering the following assumptions.
1. An enzyme - substrate complex must be formed as an intermediate
2. Rate of conversion of ES to E + P is significantly slower than ES dissociation and reassociation.
3. Only one S molecule binds to one E molecule.
 Briggs and Haldane redefined and included the fourth assumption (4) that the [S] is very large than [E], so that the [ES] is always constant, thus the rte of reaction depends on [ES].
Derivation:
 Where k1, k2, k3 are rate constants, and the overall reaction rate is dependent on [ES] Since [ES] is constant, the rate of ES formation must be equal to the rate of ES disappearance and may be expressed as rate of ES formation =rate of ES disappearance.
k1 [E] [S] = k2 [ES] + k3 [ES] where [E] represents free enzyme concentration.
At any concentration of S the fraction E of enzyme present as ES is
 F= [ES] / [E] +[ES]
[ES] = k1 [E] [S] / k2 + k3 = [E] [S] / [(k2 + k3) / k1]
Now F = [ES] / [E] + [ES] solving for [ES] we have
F= [S] / [(k2 + k3) / k1] + [S]
If the total concentration of Enzyme is [E0] than [ES]=F [E0]
= [E0]. [S] / [(k2 + k3) / k1] + [S]
The rate of product formation ‘V0’ is given by the equation
= k3 [ES]
=Kcat [ES]
( kcat – turnover number of the enzyme )
=k3 [E] [S] / [(k2 + k3) / k1] + [S]
Putting k3 [E]0 = Vmax
= Vmax [S] / [(k2 + k3) / k1] + [S]
Km= k2 + k3 / kt = [E][S] / [ES]
V0 = Vmax [S] / Km + [S]
Significance of results:
Km
Km is defined as the substrate concentration that results in half-maximal velocity for the enzymatic reaction. In other words, Km represents the substrate concentration at which half of the enzyme active sites in the sample are filled (i.e., saturated) by substrate molecules in the steady state. Units for measuring Km are moles.L-1
The value of Km varies considerably from one enzyme to another, and for a particular enzyme with different substrates. In some instances, defined changes in solution conditions like pH, temperature, etc. impart a characteristic km for a given substrate for an enzyme. The role of an enzyme in metabolism may be judged by relating the km value to the prevailing concentration of substrate.
Ex: The isoenzyme IV of hexokinase (glucokinase) is confined to the liver and has a high Km for glucose while isoenzymes I-III have a wider tissue distribution and a low Km.thus at the blood glucose in fasting is subjected to the isoenzymes I-III which are working while IV is only 25% working. Thus on intaking carbohydrate, the level of blood glucose rises and isoenzyme IV is working about half its maximum velocity and thus function instoring excess of glucose as glycogen.
Moreover it can be observed that the value of Km gets affected, in the course of comparing different mutants or isoforms of an enzyme, or different substrates with a common enzyme. In these cases one can reasonably relate the changes to effects on affinity of the ES complex.
If we know Km and Vmax, we can calculate the reaction rate of an enzyme at any given concentration of its substrate. Most enzyme reactions including those with two or more substrate can be quantitatively analysed by this theory.
Kcat
The value of Kcat is sometimes referred to as the turnover number for the enzyme which is equal to k2 in case of single substrate enzyme catalyzed reactions. Since it defines the number of catalytic turnover events that occur per unit time. The units of Kcat are reciprocal time (e.g., min-1, s-1). Turnover numbers, however, are typically reported in units of molecules of product produced per unit time per molecules of enzyme present. As long as the same units are used to express the amount of product produced and the amount of enzyme present, these units will cancel and, as expected, the final units will be reciprocal time. It is important, however, that the units of product and enzyme concentration be expressed in molar or molarity units.
Kcat /Km
The catalytic efficiency of an enzyme is best defined by the ratio of the kinetic constants of Kcat/Km. This ratio has units of a second-order rate constant and is generally used to compare the efficiencies of different enzymes to one another. The values of Kcat /Km are also used to compare the utilization of different substrates for a particular enzyme. When different substrates for an enzyme are compared, the largest differences often are seen in the values of Kcat, rather than in Km. This is because substrate specificity often results from differences in transition state, rather than ground state binding interactions. Hence, the ratio Kcat /Km captures the effects of differing substrate on either kinetic constant and provides a lower limit for the second-order rate constant of productive substrate binding (i.e., substrate binding leading to ES‡ complex formation and eventual product formation); this ratio is therefore considered to be the best measure of substrate specificity.
The specificity of an enzyme for a substrate can be described as follows
V= Vmax [S] / Km + [S] = Kcat [E]0 [S] / (Km + [S] )
( Kcat = k3 / turnover number )
Now [E0]=[E] + [ES] & [ES] = [E] [S] / Km
The ratio kcat/km can not only be used as a measure of specificity of an enzyme for a substrate.but also to compare the efficiency with which an enzyme catalyzes a particular reaction in the forward and reverse directions. Enzymatic reactions are in principle reversible, although for many enzymes the reverse reaction is thermodynamically unfavorable. The presence of an enzyme in solution does not alter the equilibrium constant Keq between the free substrate and free product concentrations. Hence, the value of Keq is fixed for specific solution conditions, and this constrains the values of Kcat /Km that can be achieved in the forward (f) and reverse (r) directions.
It is very difficult to determine the value of 1/ Vmax directly from a plot V0 against [S]. Km cannot be readily determined in this way either.
Hence the above equation is arranged in a number of ways and four best known rearrangement forms are
1. Line Weaver- Burk equation:
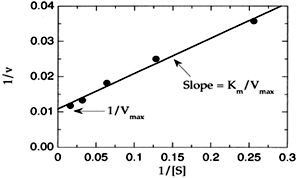 It is obtained by taking reciprocals of the two sides.
1/V0 = Km / [S]. 1/Vmax + 1/ Vmax
(y=mx+c)
Thus the plot of 1/V0 against 1/ [S] gives a straight line of slope Km /Vmax, with the intercepts on the ‘X’ and ‘Y’ axis being -1/km and 1/ Vmax.
From the plot the accurate values of Vmax and Km can be determined.
A plot obtained by studying the reaction at low substrate concentrations, it can be extrapolated without studying the reaction at saturation point These plots are useful in identifying the type of reversible inhibition.
2. The Eadie- Haftsee equation :
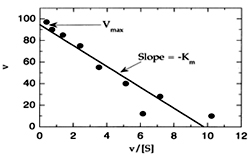 1/[S]= [Vmax/ Km]= V/ Km This plot can be obtained by multiplying the M.M equation on both sides by a factor VO.Vmax. Thus the plot of V0 against V0 / [S] gives a straight line of slope -Km with the intercepts on the ‘X’ and ‘Y’ axis being Vmax /km and Vmax.
3. The Hanes equation :
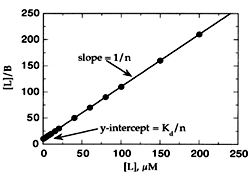 [S]/ = [S]/ Vmax + Km / Vmax A plot of [S]/ V against [S] is linear with a slope of 1/ Vmax and x-axis intercept of –km.
4. Direct linear plot :
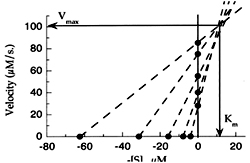 Vmax= V+V /[S]. Km In this Vmax and km are treated as variables and V and [S] are constant. The direct linear plot has several advantages a) Values of V and [S] when plotted give directly the Vmax and km and it is statistically sound.
Study of Enzyme Kinetics in vitro usually makes use of enzymes in low concentrations in the range of 10-8 and 10-10 molL-1, whereas substrate concentrations are usually m molL-1 or µmolL-1. Initially when enzyme and substrates are mixed, some enzyme is rapidly transformed to enzyme–substrate complexes. Subsequently during the initial transient period and the rate of change of the concentration of any enzyme form is very small compared with the rate of change of the substrate concentrations. That is, the rate of change of an enzyme forms with a concentration of 10-8 molL-1is always much less than the rate of change of a substrate with a concentration of 10-5 molL-1. Since the change in the levels of the various enzyme forms occurs very slowly with time, a ‘steady state’ exists. The concept of steady state always holds good whenever the concentrations of substrate are exceeding an order of magnitude higher than the enzyme level, which is usually the case for enzyme assays. Therefore the initial rate depends on initial concentration of substrate. At low substrate concentration the initial rate is proportional to initial substrate concentration. At high substrate concentration, the initial rate approaches an upper limit called the maximum rate (Vmax). In cells, under most situations; there exists a dynamic steady state, where the rate of generation of substrates is similar to the rate of removal of products. Thus the equations that describe steady state kinetics will apply to enzymes in cells as long as free, rather than total, concentrations of substrates are used in the equations
Michaelis- Menten Equation:
This equation is possible by considering the following assumptions.
1. An enzyme - substrate complex must be formed as an intermediate
2. Rate of conversion of ES to E + P is significantly slower than ES dissociation and reassociation.
3. Only one S molecule binds to one E molecule.
Briggs and Haldane redefined and included the fourth assumption (4) that the [S] is very large than [E], so that the [ES] is always constant, thus the rte of reaction depends on [ES].Derivation:
Where k1, k2, k3 are rate constants, and the overall reaction rate is dependent on [ES] Since [ES] is constant, the rate of ES formation must be equal to the rate of ES disappearance and may be expressed as rate of ES formation =rate of ES disappearance.k1 [E] [S] = k2 [ES] + k3 [ES] where [E] represents free enzyme concentration.
At any concentration of S the fraction E of enzyme present as ES is
F= [ES] / [E] +[ES] [ES] = k1 [E] [S] / k2 + k3 = [E] [S] / [(k2 + k3) / k1]
Now F = [ES] / [E] + [ES] solving for [ES] we have
F= [S] / [(k2 + k3) / k1] + [S]
If the total concentration of Enzyme is [E0] than [ES]=F [E0]
= [E0]. [S] / [(k2 + k3) / k1] + [S]
The rate of product formation ‘V0’ is given by the equation
= k3 [ES]
=Kcat [ES]
( kcat – turnover number of the enzyme )
=k3 [E] [S] / [(k2 + k3) / k1] + [S]
Putting k3 [E]0 = Vmax
= Vmax [S] / [(k2 + k3) / k1] + [S]
Km= k2 + k3 / kt = [E][S] / [ES]
V0 = Vmax [S] / Km + [S]
Significance of results:
Km
Km is defined as the substrate concentration that results in half-maximal velocity for the enzymatic reaction. In other words, Km represents the substrate concentration at which half of the enzyme active sites in the sample are filled (i.e., saturated) by substrate molecules in the steady state. Units for measuring Km are moles.L-1
The value of Km varies considerably from one enzyme to another, and for a particular enzyme with different substrates. In some instances, defined changes in solution conditions like pH, temperature, etc. impart a characteristic km for a given substrate for an enzyme. The role of an enzyme in metabolism may be judged by relating the km value to the prevailing concentration of substrate.
Ex: The isoenzyme IV of hexokinase (glucokinase) is confined to the liver and has a high Km for glucose while isoenzymes I-III have a wider tissue distribution and a low Km.thus at the blood glucose in fasting is subjected to the isoenzymes I-III which are working while IV is only 25% working. Thus on intaking carbohydrate, the level of blood glucose rises and isoenzyme IV is working about half its maximum velocity and thus function instoring excess of glucose as glycogen.
Moreover it can be observed that the value of Km gets affected, in the course of comparing different mutants or isoforms of an enzyme, or different substrates with a common enzyme. In these cases one can reasonably relate the changes to effects on affinity of the ES complex.
If we know Km and Vmax, we can calculate the reaction rate of an enzyme at any given concentration of its substrate. Most enzyme reactions including those with two or more substrate can be quantitatively analysed by this theory.
Kcat
The value of Kcat is sometimes referred to as the turnover number for the enzyme which is equal to k2 in case of single substrate enzyme catalyzed reactions. Since it defines the number of catalytic turnover events that occur per unit time. The units of Kcat are reciprocal time (e.g., min-1, s-1). Turnover numbers, however, are typically reported in units of molecules of product produced per unit time per molecules of enzyme present. As long as the same units are used to express the amount of product produced and the amount of enzyme present, these units will cancel and, as expected, the final units will be reciprocal time. It is important, however, that the units of product and enzyme concentration be expressed in molar or molarity units.
Kcat /Km
The catalytic efficiency of an enzyme is best defined by the ratio of the kinetic constants of Kcat/Km. This ratio has units of a second-order rate constant and is generally used to compare the efficiencies of different enzymes to one another. The values of Kcat /Km are also used to compare the utilization of different substrates for a particular enzyme. When different substrates for an enzyme are compared, the largest differences often are seen in the values of Kcat, rather than in Km. This is because substrate specificity often results from differences in transition state, rather than ground state binding interactions. Hence, the ratio Kcat /Km captures the effects of differing substrate on either kinetic constant and provides a lower limit for the second-order rate constant of productive substrate binding (i.e., substrate binding leading to ES‡ complex formation and eventual product formation); this ratio is therefore considered to be the best measure of substrate specificity.
The specificity of an enzyme for a substrate can be described as follows
V= Vmax [S] / Km + [S] = Kcat [E]0 [S] / (Km + [S] )
( Kcat = k3 / turnover number )
Now [E0]=[E] + [ES] & [ES] = [E] [S] / Km
The ratio kcat/km can not only be used as a measure of specificity of an enzyme for a substrate.but also to compare the efficiency with which an enzyme catalyzes a particular reaction in the forward and reverse directions. Enzymatic reactions are in principle reversible, although for many enzymes the reverse reaction is thermodynamically unfavorable. The presence of an enzyme in solution does not alter the equilibrium constant Keq between the free substrate and free product concentrations. Hence, the value of Keq is fixed for specific solution conditions, and this constrains the values of Kcat /Km that can be achieved in the forward (f) and reverse (r) directions.
It is very difficult to determine the value of 1/ Vmax directly from a plot V0 against [S]. Km cannot be readily determined in this way either.
Hence the above equation is arranged in a number of ways and four best known rearrangement forms are
1. Line Weaver- Burk equation:
It is obtained by taking reciprocals of the two sides.1/V0 = Km / [S]. 1/Vmax + 1/ Vmax
(y=mx+c)
Thus the plot of 1/V0 against 1/ [S] gives a straight line of slope Km /Vmax, with the intercepts on the ‘X’ and ‘Y’ axis being -1/km and 1/ Vmax.
From the plot the accurate values of Vmax and Km can be determined.
A plot obtained by studying the reaction at low substrate concentrations, it can be extrapolated without studying the reaction at saturation point These plots are useful in identifying the type of reversible inhibition.
2. The Eadie- Haftsee equation :
1/[S]= [Vmax/ Km]= V/ Km This plot can be obtained by multiplying the M.M equation on both sides by a factor VO.Vmax. Thus the plot of V0 against V0 / [S] gives a straight line of slope -Km with the intercepts on the ‘X’ and ‘Y’ axis being Vmax /km and Vmax.3. The Hanes equation :
[S]/ = [S]/ Vmax + Km / Vmax A plot of [S]/ V against [S] is linear with a slope of 1/ Vmax and x-axis intercept of –km.4. Direct linear plot :
Vmax= V+V /[S]. Km In this Vmax and km are treated as variables and V and [S] are constant. The direct linear plot has several advantages a) Values of V and [S] when plotted give directly the Vmax and km and it is statistically sound.Published date : 16 May 2014 03:39PM


More Articles