
Sakshi Education
 Key Points:
 - The Census of India provides us with information regarding the population. It organises the collection and recording of the information of Indian population. In India, the census is conducted once in every 10 years.
- The age structure of a population refers to the number of males and females in different age groups in a country. They are children, working age and aged people.
- 92 % of the working people in India are in the unorganized sector.
- Sex ratio is the number of females per 1000 males in the population.
- Women and girls in particular are suffering from in equal opportunities for education and development. The census shows that in the age group 0-5, the number of girls who survive is much lower than boys.
- Women's education has been a powerful force in reducing discrimination against women.
- According to the Census of 2011, a person aged 7 years and above who can read and write with understanding in any language, is treated as 'Literate'.
- Births, deaths and migrations can influence the size of population.
- India is one of the most densely populated counties in the world. The population density of India is 382 as per 2011 census. It is calculated as the number of persons per unit area; in India the standard spatial unit is square kilometre.
- According to 2001 census, the growth rate of population seems to be reducing. This is an inevitable situation.
- Fertility rate indicates that on an average each women was likely to bear children.
- Migration is the movement of people across regions and territories.
- Population Growth: It is the change in population over time and can be quantified as the change is the number of individuals of humans.
- Population Density: Population density provides a better picture of population distribution. Population density is calculated as the number of persons per square kilometre area.
- Sex Ratio: Sex ratio is the number of females per 1000 males in the population.
- Fertility Rate: Fertility rate is a term used to refer to the capacity of people is a given region to give birth. It is calculated per the number of women who are the child bearing age group. Presently, it is 2.7 in India.
- Population Distribution: It refers to the spread of arrangement of people living in a nation of the world.
- Infanticide: The act of killing of a new born child. Infanticide usually committed by the parents or by others with parents’ consent.
- Literacy Rate: The literacy rate is the percentage of people with the ability to read and write. India has 74.04% of literacy rate according to the 2011 - census.
1. List out the impacts on society if sex ratio is too low or too high?
- Sex ratio is the number of females per 1000 males in the population. This information is an important social indicator to measure the extent of equality between men and women in a society.
- The sex ratio is a cause of concern as it indicates a hidden form of discrimination.
- Regions that have unequal gender relations favour the males and discriminate against the females and end up with low sex ratio.
- Low sex ratio indicates the inequality between male and females in a society. Low sex ratio leads more social misdeeds such as child marriages.
- Low sex ratio is a cause for low female literacy rate. Gender imbalance will also lead to a reduction in birth rate.
- If there was no discrimination, the number of girls should be higher as much as boys.
- Female literacy rate increases if the sex ratio is high.
- There may be no child marriages when there is high sex ratio.
- High sex ratio is an indication of absence of gender discrimination.
- If the sex ratio is high, women will enter every walk of life and participate in country’s development.
- Population growth is dynamic. The numbers, distribution and composition of the population always change.
- Change in the size of population is the difference in the number of in habitants of a country or territory during a specific period. Say during the last ten years.
- The absolute numbers added each decade indicates scale of increase of decrease; in our case it is always an increase. This difference is obtained by simply subtracting the earlier population figure from the latest one. If the result is a positive number, the population has increased. If it is a negative number, the population has decreased by that number.
Population change (absolute number) = Population later date - Population at earlier date - Population change in a place = (Number of births + number of in migrants) - Number of deaths+ number of out - migrants)
- The rate or the pace of population increase is studied in per cent per annum. This is referred to as the annual growth rate of population.
- High birth rates together with declining death rates lead to high rates of population growth.
- Population growth refers that the population is increasing in number time to time in a country of territory whereas population change indicates the population increase or decrease in a country.
- Migration plays a very significant role in changing the composition and distribution of population.
- Population density provides a better picture of its distribution. Population density is calculated as the number of persons per unit area.
- There are three physical divisions in Andhra Pradesh. They are Telangana, Coastal Andhra and Rayalaseema. According to 2011 census Coastal Andhra has high population density. This area is in Coastal plains and deltas.
- The Coastal Andhra area has fertile land. Agriculture has been well developed in these areas, so, more number of people has different employment opportunities in this area.
- AP has favourable living conditions. Hence, it has high density of population.
Short Answer Questions
1. Identify the false statements and correct them?
a) Census data is collected every 10 years [The statements is correct]
b) Sex ratio refers to the number of female is adult population [ False]
Note: Sex ratio refers to the number of female per 1000 male
c) Age structure shows us the distribution of people according to their age [The statements is correct]
d) Population density is higher in mountain areas as people like the climate there [False]
Note: Population density is lower in mountains due to highly dissected and rocky nature of the terrain, moderate to low rainfall, shallow and less fertile soils.
2 .Based on the following table answer the questions below
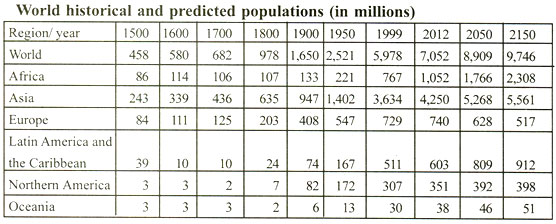
- Identify roughly how many centuries it took for the world population to double for the first time. [300 Years]
- In earlier classes you had studied about colonisation. Look at the table and identify in which of the continents the population decreased by 1800. [Oceania]
- Which continent has been most populous for most period of time? [Asia]
- Is there any continent that is projected to show a significant decrease in population in future? [Europe]
Brazil, Sri Lanka, South Africa, Nepal, Bangladesh, Norway, Chile, Indonesia.
What similarities and differences do you note?
a) Comparison of Indian Literacy rate with other countries
| 1) India (2011 census) Literacy rate: | 74.04% |
| 2) Brazil: | 90.04% |
| 3) Sri Lanka: | `91.2% |
| 4) South Africa: | 93% |
| 5) Nepal: | 66% |
| 6) Bangladesh: | 57.7% |
| 7) Norway: | 100% |
| 8) Chile: | 98.6% |
| 9) Indonesia: | 90.4% |
- India has 74.04% of literacy rate according to the 2011 census.
- Nepal and Bangladesh Countries have poor literacy rate than India.
- Brazil, Sri Lanka, South Africa, Norway and Chile have more literacy rates than India.
- Only Norway has 100% literacy rate.
- All the European Countries have high literacy rate.
- Which country's population is likely to grow?
- Which country's population is likely to reduce?
- Compare the gender balance. What can you tell about each country's family and welfare policies?
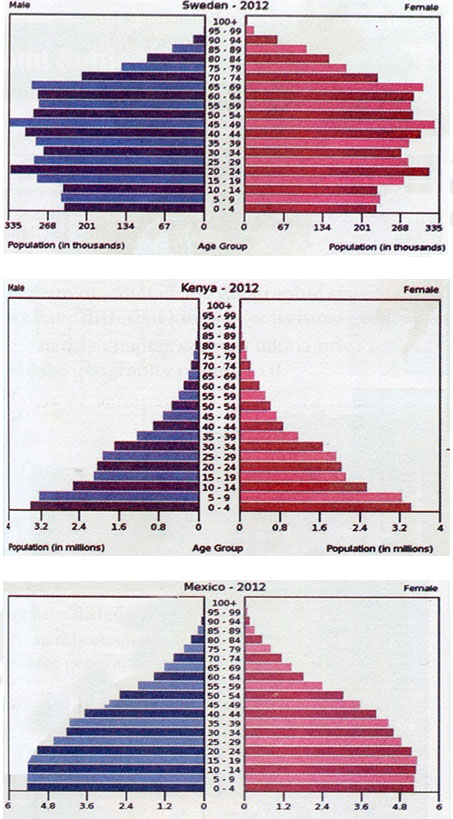
- India's population is likely to grow.
- Sweden's population is likely to decrease as there is a low birth rate.
- India has low sex ratio that of 940 females per 1000 males. There is a gender imbalance in India compared to other countries. Mexico has high sex ratio of 1041.
Published date : 18 Dec 2014 06:44PM


More Articles


Most Read