

Sakshi Education
Introduction:
The Elasticity of Demand (Ed) also referred to as the Price Elasticity of Demand, measures how responsive demand is to changes in price of a given good. More precisely, it is the percent change in quantity demanded relative to a one percent change in price, holding all else constant.
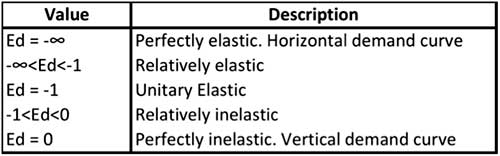
Demand of goods can be classified as either perfectly elastic, elastic, unitary elastic, inelastic, or perfectly inelastic based on the elasticity of demand. The table below shows the values of elasticity of demand that correspond to the different categories.
Definition:
Marshall’s opinion:
A person’s demand for a thing should always “reference to the prices at which he would buy that amount and other amounts”.
“The term elasticity is defined as the rate of responsiveness in the demand of a commodity for a given change in price or any other determents of demand”.
Types of Elasticity of Demand:
Generally, elasticity of demand refers to price elasticity of demand which is often called own price elasticity of demand, though the notion of elasticity of demand also relates to income, cross and substitution elasticity’s of demand.
After knowing what is demand and what is law of demand, we can now come to elasticity of demand. Law of demand will tell you the direction i.e. it tells you which way the demand goes when the price changes. But the elasticity of demand tells you how much the demand will change with the change in price to demand to the change in any factor.
Different types of Elasticity of Demand:
We will discuss how sensitive the change in demand is to the change in price. The measurement of this sensitivity in terms of percentage is called price Elasticity of Demand.
Income elasticity of demand:
In economics, the income elasticity of demand measures the responsiveness of the quantity demanded of a good to the change in the income of the people demanding the good. For example, if, in response to a 10% increase in income, the quantity of a good demanded increased by 20%, the income elasticity of demand would be 20%/10% = 2.
Cross elasticity of demand:
In economics, the cross elasticity of demand and cross price elasticity of demand measures the responsiveness of the quantity demand of a good to a change in the price of another good. It is measured as the percentage change in quantity demanded for the first good that occurs in response to a percentage change in price of the second good. For example, if, in response to a 10% increase in the price of fuel, the quantity of new cars that are fuel inefficient demanded decreased by 20%, the cross elasticity of demand would be -20%/10% = -2.
Types of Price Elasticity of Demands:
a) Perfectly Elastic
b) Perfectly Inelastic
c) Relatively Elastic
d) Relatively Inelastic
e) Unit Elasticity
Perfectly Elastic:
It refers to the situation where the slightest rise in price causes the quantity demanded of a commodity to fall to zero and at the present level of price people demand infinitely large quantity of the commodity.
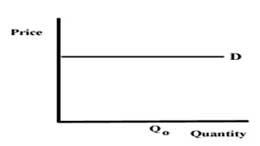
Fig 1: Perfectly Elastic
Perfectly inelastic demand:
It refers to the situation where even substantial changes in price do not make any change in the quantity demanded, i.e., for any change in the price, the demand remains constant. The coefficient of elasticity of demand is zero.
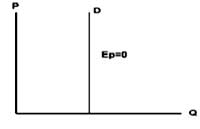
Fig 2: Perfectly inelastic demand
Relatively elastic demand:
Here, a small proportionate change in the price of a commodity results in a larger proportionate change in its quantity demanded. The coefficient of elasticity of demand is greater than unity.
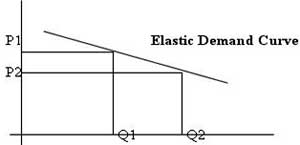
Fig 3: Relatively elastic demand
Relatively Inelastic demand:
A larger proportionate change in the price of a commodity results in a smaller proportionate change in its quantity demanded. The coefficient of elasticity of demand is greater than zero, but less than unity.
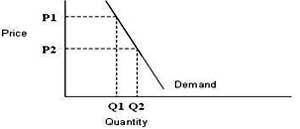
Fig 4: Relatively Inelastic demand
Unitary income elasticity:
A given proportionate rise in the consumer’s money income is accompanied by an equally proportionate rise in the quantity demanded of a commodity and vice versa (Ei=1).
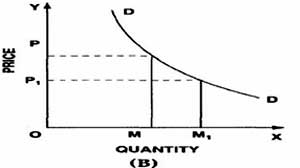
Fig 5: Unitary income elasticity
Demand Forecasting:
Forecasting product demand is crucial to any supplier, manufacturer, or retailer. Forecasts of future demand will determine the quantities that should be purchased, produced, and shipped. Demand forecasts are necessary since the basic operations process, moving from the suppliers' raw materials to finished goods in the customers' hands, takes time. Most firms cannot simply wait for demand to emerge and then react to it. Instead, they must anticipate and plan for future demand so that they can react immediately to customer orders as they occur. In other words, most manufacturers "make to stock" rather than "make to order" – they plan ahead and then deploy inventories of finished goods into field locations.
Thus, once a customer order materializes, it can be fulfilled immediately – since most customers are not willing to wait the time it would take to actually process their order throughout the supply chain and make the product based on their order. An order cycle could take weeks or months to go back through part suppliers and sub-assemblers, through manufacture of the product, and through to the eventual shipment of the order to the customer.
Methods of Demand Forecasting:
Survey method:
Broadly speaking, there are two approaches to demand forecasting- one is to obtain information about the likely purchase behavior of the buyer through collecting expert’s opinion or by conducting interviews with consumers, the other is to use past experience as a guide through a set of statistical techniques. Both these methods rely on varying degrees of judgment. The first method is usually found suitable for short-term forecasting, the latter for long-term forecasting. There are specific techniques which fall under each of these broad methods.
Experts Opinion Poll:
In this method, the experts are requested to give their ‘opinion’ or ‘feel’ about the product. These experts, dealing in the same or similar product, are able to predict the likely sales of a given product in future periods under different conditions based on their experience. If the number of such experts is large and their experience-based reactions are different, then an average-simple or weighted –is found to lead to unique forecasts.
Reasoned Opinion-Delphi Technique:
This is a variant of the opinion poll method. Here is an attempt to arrive at a consensus in an uncertain area by questioning a group of experts repeatedly until the responses appear to converge along a single line. The participants are supplied with responses to previous questions (including seasonings from others in the group by a coordinator or a leader or operator of some sort).
End-user Method of Consumers Survey:
Under this method, the sales of a product are projected through a survey of its end-users. A product is used for final consumption or as an intermediate product in the production of other goods in the domestic market, or it may be exported as well as imported.
Complex Statistical Methods:
We shall now move from simple to complex set of methods of demand forecasting. Such methods are taken usually from statistics. As such, you may be quite familiar with some the statistical tools and techniques, as a part of quantitative methods for business decisions.
Time series analysis or trend method:
Under this method, the time series data on the under forecast are used to fit a trend line or curve either graphically or through statistical method of Least Squares. The trend line is worked out by fitting a trend equation to time series data with the aid of an estimation method.
The advantage in this method is that it does not require the formal knowledge of economic theory and the market; it only needs the time series data. The only limitation in this method is that it assumes that the past is repeated in future. Also, it is an appropriate method for long-run forecasts, but inappropriate for short-run forecasts.
Barometric Method:
In barometric method, demand is predicted on the basis of past events or key variables occurring in the present. This method is also used to predict various economic indicators, such as saving, investment, and income. This method was introduced by Harvard Economic Service in 1920 and further revised by National Bureau of Economic Research (NBER) in 1930s.
This technique helps in determining the general trend of business activities. For example, suppose government allots land to the XYZ society for constructing buildings. This indicates that there would be high demand for cement, bricks, and steel.
The main advantage of this method is that it is applicable even in the absence of past data. However, this method is not applicable in case of new products. In addition, it loses its applicability when there is no time lag between economic indicator and demand.
Econometric Methods:
Econometric methods combine statistical tools with economic theories for forecasting. The forecasts made by this method are very reliable than any other method. An econometric model consists of two types of methods namely, regression model and simultaneous equations model.
Other Statistical Measures:
Apart from statistical methods, there are other methods for demand forecasting. These measures are very specific and used for only particular datasets. Therefore, there usage cannot be generalized for all types of research.
Expert Opinion Method:
The firm makes an effort to obtain the opinion of experts who have long standing experience in the field of enquiry related to the product under consideration. If the forecast is based on the opinion of several experts then the approach is called forecasting through the use of panel consensus. Although the panel consensus method usually results in forecasts that embody the collective wisdom of consulted experts, it may be at times unfavorably affected by the force of personality of one or few key individuals.
To counter this disadvantage of panel consensus, another approach is developed called the Delphi method. In this method a panel of experts is individually presented a series of questions pertaining to the forecasting problem. Responses acquired from the experts are analyzed by an independent party that will provide the feedback to the panel members. Based on the responses of other individuals, each expert is then asked to make a revised forecast. This process continues till a consensus is reached or until further iterations generate no change in estimates.
Test Marketing:
A variant of sample survey technique is test marketing. Product testing essentially involves placing the product with a number of users for a set period. Their reactions to the product are noted after a period of time and an estimate of likely demand is made from the result. These are suitable for new products or for radically modified old products for which no prior data exists. It is a more scientific method of estimating likely demand because it stimulates a national launch in a closely defined geo¬graphical area.
Controlled experiments:
It is referred to such exercises, where some of the major determinants of demand are manipulated to suit to the customers with different taste and preferences, income group and such others. It is further assumed that all other factors remain the same. In this method the product is introduced with different packages, different prices in different markets or same. Markets to assess which combination appeals to the customers most, regression equation can be built up on these price and quantity relationship. This method is still in the infancy stage and not much tried because of the following reasons:
Judgmental approach to demand forecasting: This involves a ‘bottom up’ method, where each individual/respondent contributes to the overall result; this could be for product demand or sales forecasting; also for opinion surveys amongst employees, citizen groups or voter groups for election polls.
Sales Force Composites: Here, the similar ‘bottom up approach’ is used for building up sales forecasts on any criteria like region-wise or product wise sales territory groupings from sales force personnel.
Consensus of Executive Opinion: This is normally deployed in strategy formulation by sought opinions from key organizational stakeholders- managers, suppliers, customers, bankers and shareholders.
Historical analogy: This is used for forecasting new product demand as similar to the previously introduced new product benefiting from its immediacy that same demand influencing factors will apply consensus thro “Delphi method ‘especially for new product developments and technology trends forecasting. It is the most formal judgmental method and has a well defined process overcoming most of the problems of earlier ‘consensus by executive opinion. This involves sending out questionnaires to a panel of experts regarding a forecast subject. Their replies are analyzed, summarized, processed and redistributed to the panel for revisions in light of other’s arguments and viewpoints. By going through such an iterative process say 3-4 times, the final panel forecast is considered as fairly accurate and authentic
Yet, difficulties do exist in planning, administering and integrating member views into a meaningful whole.
The Elasticity of Demand (Ed) also referred to as the Price Elasticity of Demand, measures how responsive demand is to changes in price of a given good. More precisely, it is the percent change in quantity demanded relative to a one percent change in price, holding all else constant.
Demand of goods can be classified as either perfectly elastic, elastic, unitary elastic, inelastic, or perfectly inelastic based on the elasticity of demand. The table below shows the values of elasticity of demand that correspond to the different categories.
Definition:
Marshall’s opinion:
A person’s demand for a thing should always “reference to the prices at which he would buy that amount and other amounts”.
“The term elasticity is defined as the rate of responsiveness in the demand of a commodity for a given change in price or any other determents of demand”.
Types of Elasticity of Demand:
Generally, elasticity of demand refers to price elasticity of demand which is often called own price elasticity of demand, though the notion of elasticity of demand also relates to income, cross and substitution elasticity’s of demand.
After knowing what is demand and what is law of demand, we can now come to elasticity of demand. Law of demand will tell you the direction i.e. it tells you which way the demand goes when the price changes. But the elasticity of demand tells you how much the demand will change with the change in price to demand to the change in any factor.
Different types of Elasticity of Demand:
- Price Elasticity of Demand
- Income Elasticity of Demand
- Cross Elasticity of Demand
- Advertisement Elasticity of Demand
We will discuss how sensitive the change in demand is to the change in price. The measurement of this sensitivity in terms of percentage is called price Elasticity of Demand.
Income elasticity of demand:
In economics, the income elasticity of demand measures the responsiveness of the quantity demanded of a good to the change in the income of the people demanding the good. For example, if, in response to a 10% increase in income, the quantity of a good demanded increased by 20%, the income elasticity of demand would be 20%/10% = 2.
Cross elasticity of demand:
In economics, the cross elasticity of demand and cross price elasticity of demand measures the responsiveness of the quantity demand of a good to a change in the price of another good. It is measured as the percentage change in quantity demanded for the first good that occurs in response to a percentage change in price of the second good. For example, if, in response to a 10% increase in the price of fuel, the quantity of new cars that are fuel inefficient demanded decreased by 20%, the cross elasticity of demand would be -20%/10% = -2.
Types of Price Elasticity of Demands:
a) Perfectly Elastic
b) Perfectly Inelastic
c) Relatively Elastic
d) Relatively Inelastic
e) Unit Elasticity
Perfectly Elastic:
It refers to the situation where the slightest rise in price causes the quantity demanded of a commodity to fall to zero and at the present level of price people demand infinitely large quantity of the commodity.
Fig 1: Perfectly Elastic
Perfectly inelastic demand:
It refers to the situation where even substantial changes in price do not make any change in the quantity demanded, i.e., for any change in the price, the demand remains constant. The coefficient of elasticity of demand is zero.
Fig 2: Perfectly inelastic demand
Relatively elastic demand:
Here, a small proportionate change in the price of a commodity results in a larger proportionate change in its quantity demanded. The coefficient of elasticity of demand is greater than unity.
Fig 3: Relatively elastic demand
Relatively Inelastic demand:
A larger proportionate change in the price of a commodity results in a smaller proportionate change in its quantity demanded. The coefficient of elasticity of demand is greater than zero, but less than unity.
Fig 4: Relatively Inelastic demand
Unitary income elasticity:
A given proportionate rise in the consumer’s money income is accompanied by an equally proportionate rise in the quantity demanded of a commodity and vice versa (Ei=1).
Fig 5: Unitary income elasticity
Demand Forecasting:
Forecasting product demand is crucial to any supplier, manufacturer, or retailer. Forecasts of future demand will determine the quantities that should be purchased, produced, and shipped. Demand forecasts are necessary since the basic operations process, moving from the suppliers' raw materials to finished goods in the customers' hands, takes time. Most firms cannot simply wait for demand to emerge and then react to it. Instead, they must anticipate and plan for future demand so that they can react immediately to customer orders as they occur. In other words, most manufacturers "make to stock" rather than "make to order" – they plan ahead and then deploy inventories of finished goods into field locations.
Thus, once a customer order materializes, it can be fulfilled immediately – since most customers are not willing to wait the time it would take to actually process their order throughout the supply chain and make the product based on their order. An order cycle could take weeks or months to go back through part suppliers and sub-assemblers, through manufacture of the product, and through to the eventual shipment of the order to the customer.
Methods of Demand Forecasting:
Survey method:
Broadly speaking, there are two approaches to demand forecasting- one is to obtain information about the likely purchase behavior of the buyer through collecting expert’s opinion or by conducting interviews with consumers, the other is to use past experience as a guide through a set of statistical techniques. Both these methods rely on varying degrees of judgment. The first method is usually found suitable for short-term forecasting, the latter for long-term forecasting. There are specific techniques which fall under each of these broad methods.
Experts Opinion Poll:
In this method, the experts are requested to give their ‘opinion’ or ‘feel’ about the product. These experts, dealing in the same or similar product, are able to predict the likely sales of a given product in future periods under different conditions based on their experience. If the number of such experts is large and their experience-based reactions are different, then an average-simple or weighted –is found to lead to unique forecasts.
Reasoned Opinion-Delphi Technique:
This is a variant of the opinion poll method. Here is an attempt to arrive at a consensus in an uncertain area by questioning a group of experts repeatedly until the responses appear to converge along a single line. The participants are supplied with responses to previous questions (including seasonings from others in the group by a coordinator or a leader or operator of some sort).
End-user Method of Consumers Survey:
Under this method, the sales of a product are projected through a survey of its end-users. A product is used for final consumption or as an intermediate product in the production of other goods in the domestic market, or it may be exported as well as imported.
Complex Statistical Methods:
We shall now move from simple to complex set of methods of demand forecasting. Such methods are taken usually from statistics. As such, you may be quite familiar with some the statistical tools and techniques, as a part of quantitative methods for business decisions.
Time series analysis or trend method:
Under this method, the time series data on the under forecast are used to fit a trend line or curve either graphically or through statistical method of Least Squares. The trend line is worked out by fitting a trend equation to time series data with the aid of an estimation method.
The advantage in this method is that it does not require the formal knowledge of economic theory and the market; it only needs the time series data. The only limitation in this method is that it assumes that the past is repeated in future. Also, it is an appropriate method for long-run forecasts, but inappropriate for short-run forecasts.
Barometric Method:
In barometric method, demand is predicted on the basis of past events or key variables occurring in the present. This method is also used to predict various economic indicators, such as saving, investment, and income. This method was introduced by Harvard Economic Service in 1920 and further revised by National Bureau of Economic Research (NBER) in 1930s.
This technique helps in determining the general trend of business activities. For example, suppose government allots land to the XYZ society for constructing buildings. This indicates that there would be high demand for cement, bricks, and steel.
The main advantage of this method is that it is applicable even in the absence of past data. However, this method is not applicable in case of new products. In addition, it loses its applicability when there is no time lag between economic indicator and demand.
Econometric Methods:
Econometric methods combine statistical tools with economic theories for forecasting. The forecasts made by this method are very reliable than any other method. An econometric model consists of two types of methods namely, regression model and simultaneous equations model.
Other Statistical Measures:
Apart from statistical methods, there are other methods for demand forecasting. These measures are very specific and used for only particular datasets. Therefore, there usage cannot be generalized for all types of research.
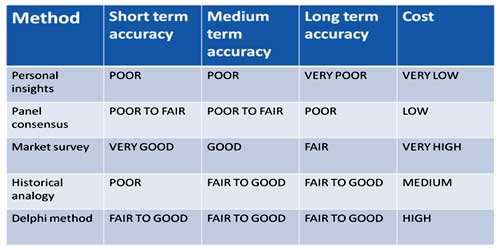
Expert Opinion Method:
The firm makes an effort to obtain the opinion of experts who have long standing experience in the field of enquiry related to the product under consideration. If the forecast is based on the opinion of several experts then the approach is called forecasting through the use of panel consensus. Although the panel consensus method usually results in forecasts that embody the collective wisdom of consulted experts, it may be at times unfavorably affected by the force of personality of one or few key individuals.
To counter this disadvantage of panel consensus, another approach is developed called the Delphi method. In this method a panel of experts is individually presented a series of questions pertaining to the forecasting problem. Responses acquired from the experts are analyzed by an independent party that will provide the feedback to the panel members. Based on the responses of other individuals, each expert is then asked to make a revised forecast. This process continues till a consensus is reached or until further iterations generate no change in estimates.
Test Marketing:
A variant of sample survey technique is test marketing. Product testing essentially involves placing the product with a number of users for a set period. Their reactions to the product are noted after a period of time and an estimate of likely demand is made from the result. These are suitable for new products or for radically modified old products for which no prior data exists. It is a more scientific method of estimating likely demand because it stimulates a national launch in a closely defined geo¬graphical area.
Controlled experiments:
It is referred to such exercises, where some of the major determinants of demand are manipulated to suit to the customers with different taste and preferences, income group and such others. It is further assumed that all other factors remain the same. In this method the product is introduced with different packages, different prices in different markets or same. Markets to assess which combination appeals to the customers most, regression equation can be built up on these price and quantity relationship. This method is still in the infancy stage and not much tried because of the following reasons:
- It is costly and time consuming.
- It involves elaborate process of studying different markets and different permutations.
- If it fails in one market fails in another market also.
Judgmental approach to demand forecasting: This involves a ‘bottom up’ method, where each individual/respondent contributes to the overall result; this could be for product demand or sales forecasting; also for opinion surveys amongst employees, citizen groups or voter groups for election polls.
Sales Force Composites: Here, the similar ‘bottom up approach’ is used for building up sales forecasts on any criteria like region-wise or product wise sales territory groupings from sales force personnel.
Consensus of Executive Opinion: This is normally deployed in strategy formulation by sought opinions from key organizational stakeholders- managers, suppliers, customers, bankers and shareholders.
Historical analogy: This is used for forecasting new product demand as similar to the previously introduced new product benefiting from its immediacy that same demand influencing factors will apply consensus thro “Delphi method ‘especially for new product developments and technology trends forecasting. It is the most formal judgmental method and has a well defined process overcoming most of the problems of earlier ‘consensus by executive opinion. This involves sending out questionnaires to a panel of experts regarding a forecast subject. Their replies are analyzed, summarized, processed and redistributed to the panel for revisions in light of other’s arguments and viewpoints. By going through such an iterative process say 3-4 times, the final panel forecast is considered as fairly accurate and authentic
Yet, difficulties do exist in planning, administering and integrating member views into a meaningful whole.
Published date : 17 Jul 2015 04:47PM